.svg)
Continu Insights
Real-time dashboards, AI-powered queries, and Salesforce integration give you the data to prove enablement drives revenue — and automatically share it with stakeholders.

SOC 2 Compliant

GDPR & CCPA Compliant
Trusted by the world’s leading enterprises


The easiest-to-use learning analytics suite on the market. No data scientists needed.

Ties enablement to revenue
Salesforce integration connects enablement data to pipeline velocity, deal size, and win rates — proving ROI to the C-suite.

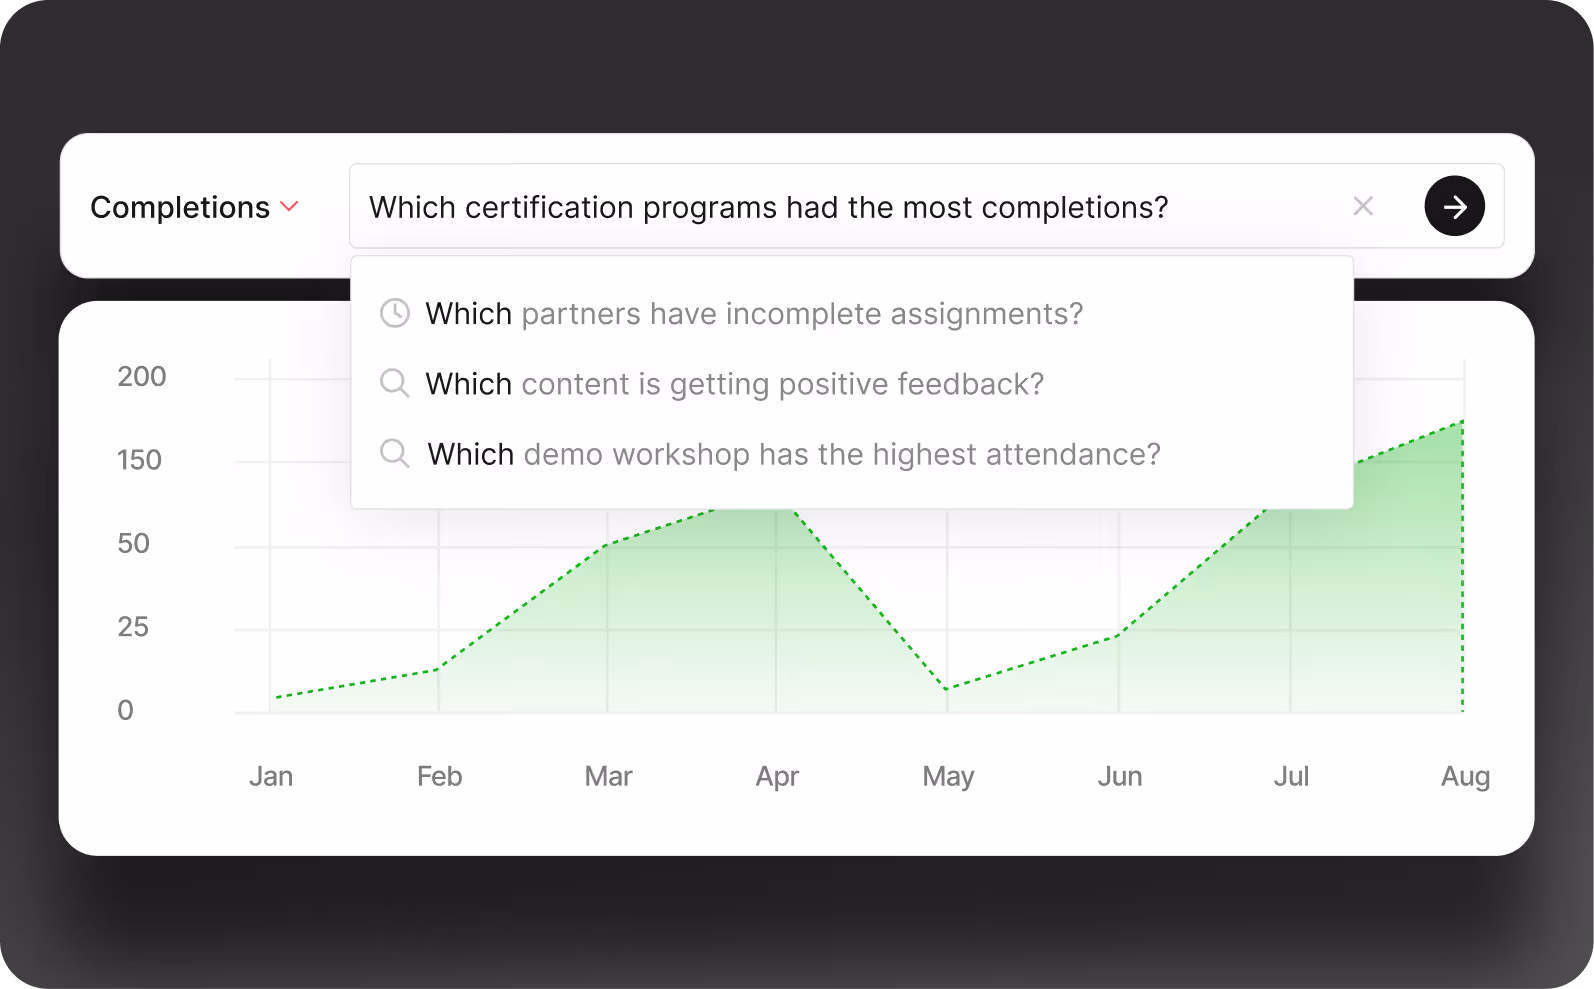
Ask questions, get answers
AI-powered queries let you ask about your data in plain English. No SQL, no report builder, no waiting.

Always real-time
Dashboards update live — no stale exports, no scheduled refreshes. Leadership sees current data every time they look.
"We’re not just trying to target the completion of learning, but also trying to target business outcomes from the insights we’re getting out of the platform."

Samathmika Balaji
Principal Learning Experience Program Manager
Use plain English questions to get instant answers about your learning data with AI-powered conversational intelligence. Build entire dashboards of insightful analytics without the need for a data team.
With curated executive summaries, leadership gets immediate clarity on the impact of training. Easily share reports that link learning outcomes to business performance—backed by data that’s continuously analyzed and updated in real time
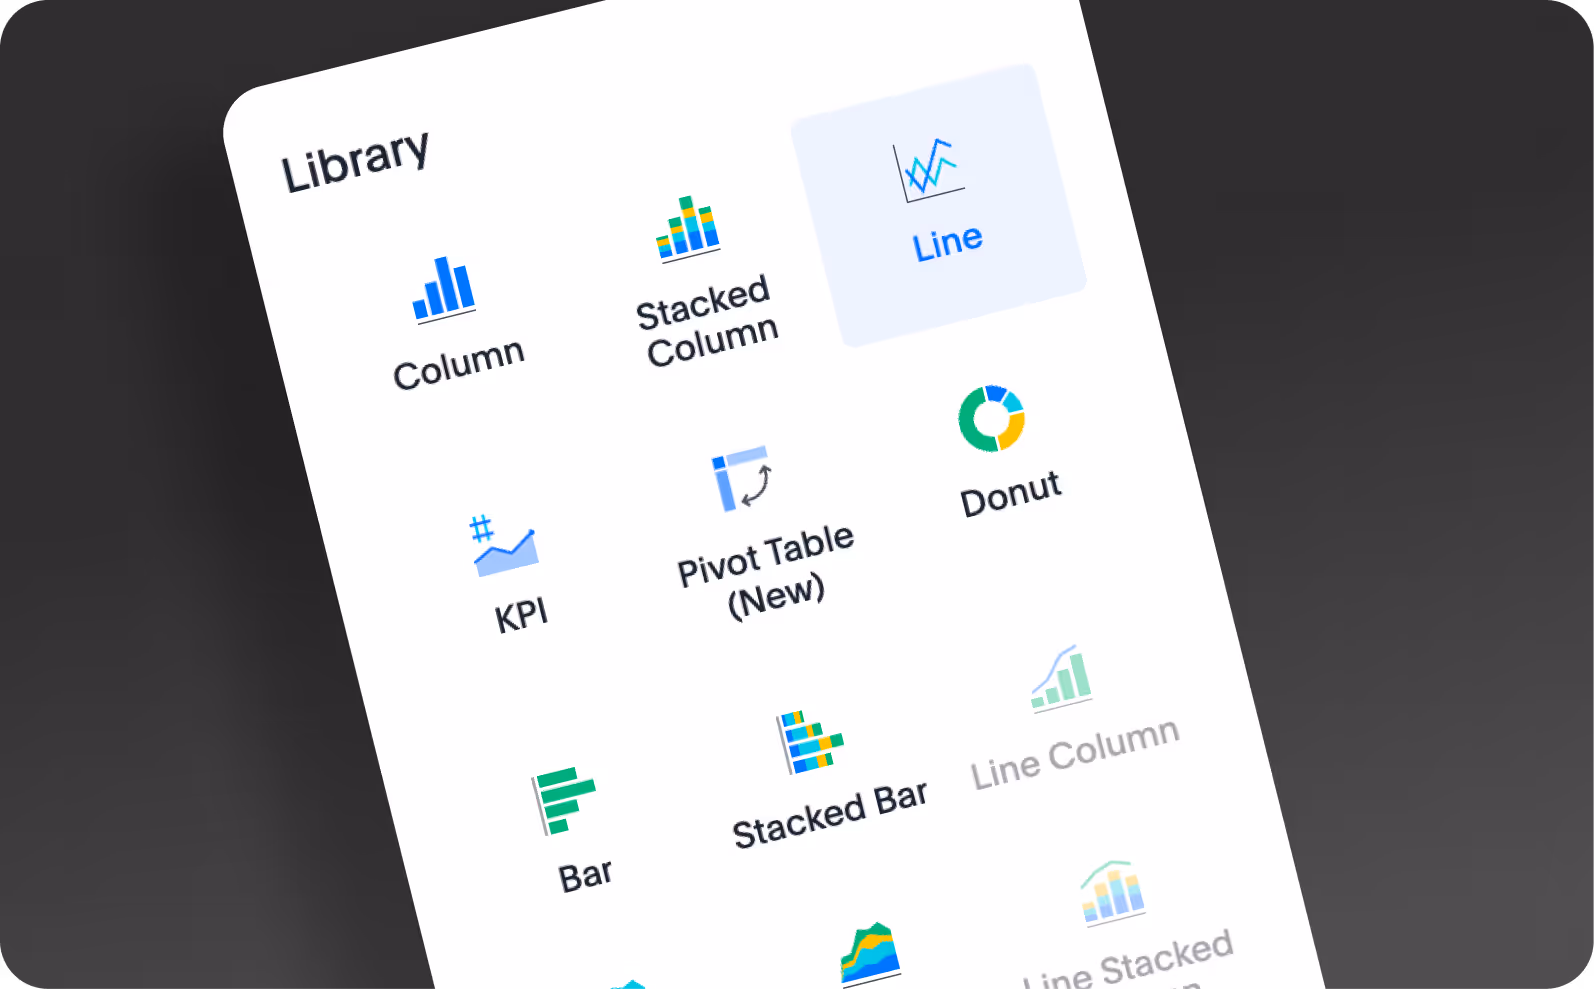
Columns, bar graphs, donut charts, and much more... You have full customization with tons of options so your data not only informs your learning decisions, but looks good too.

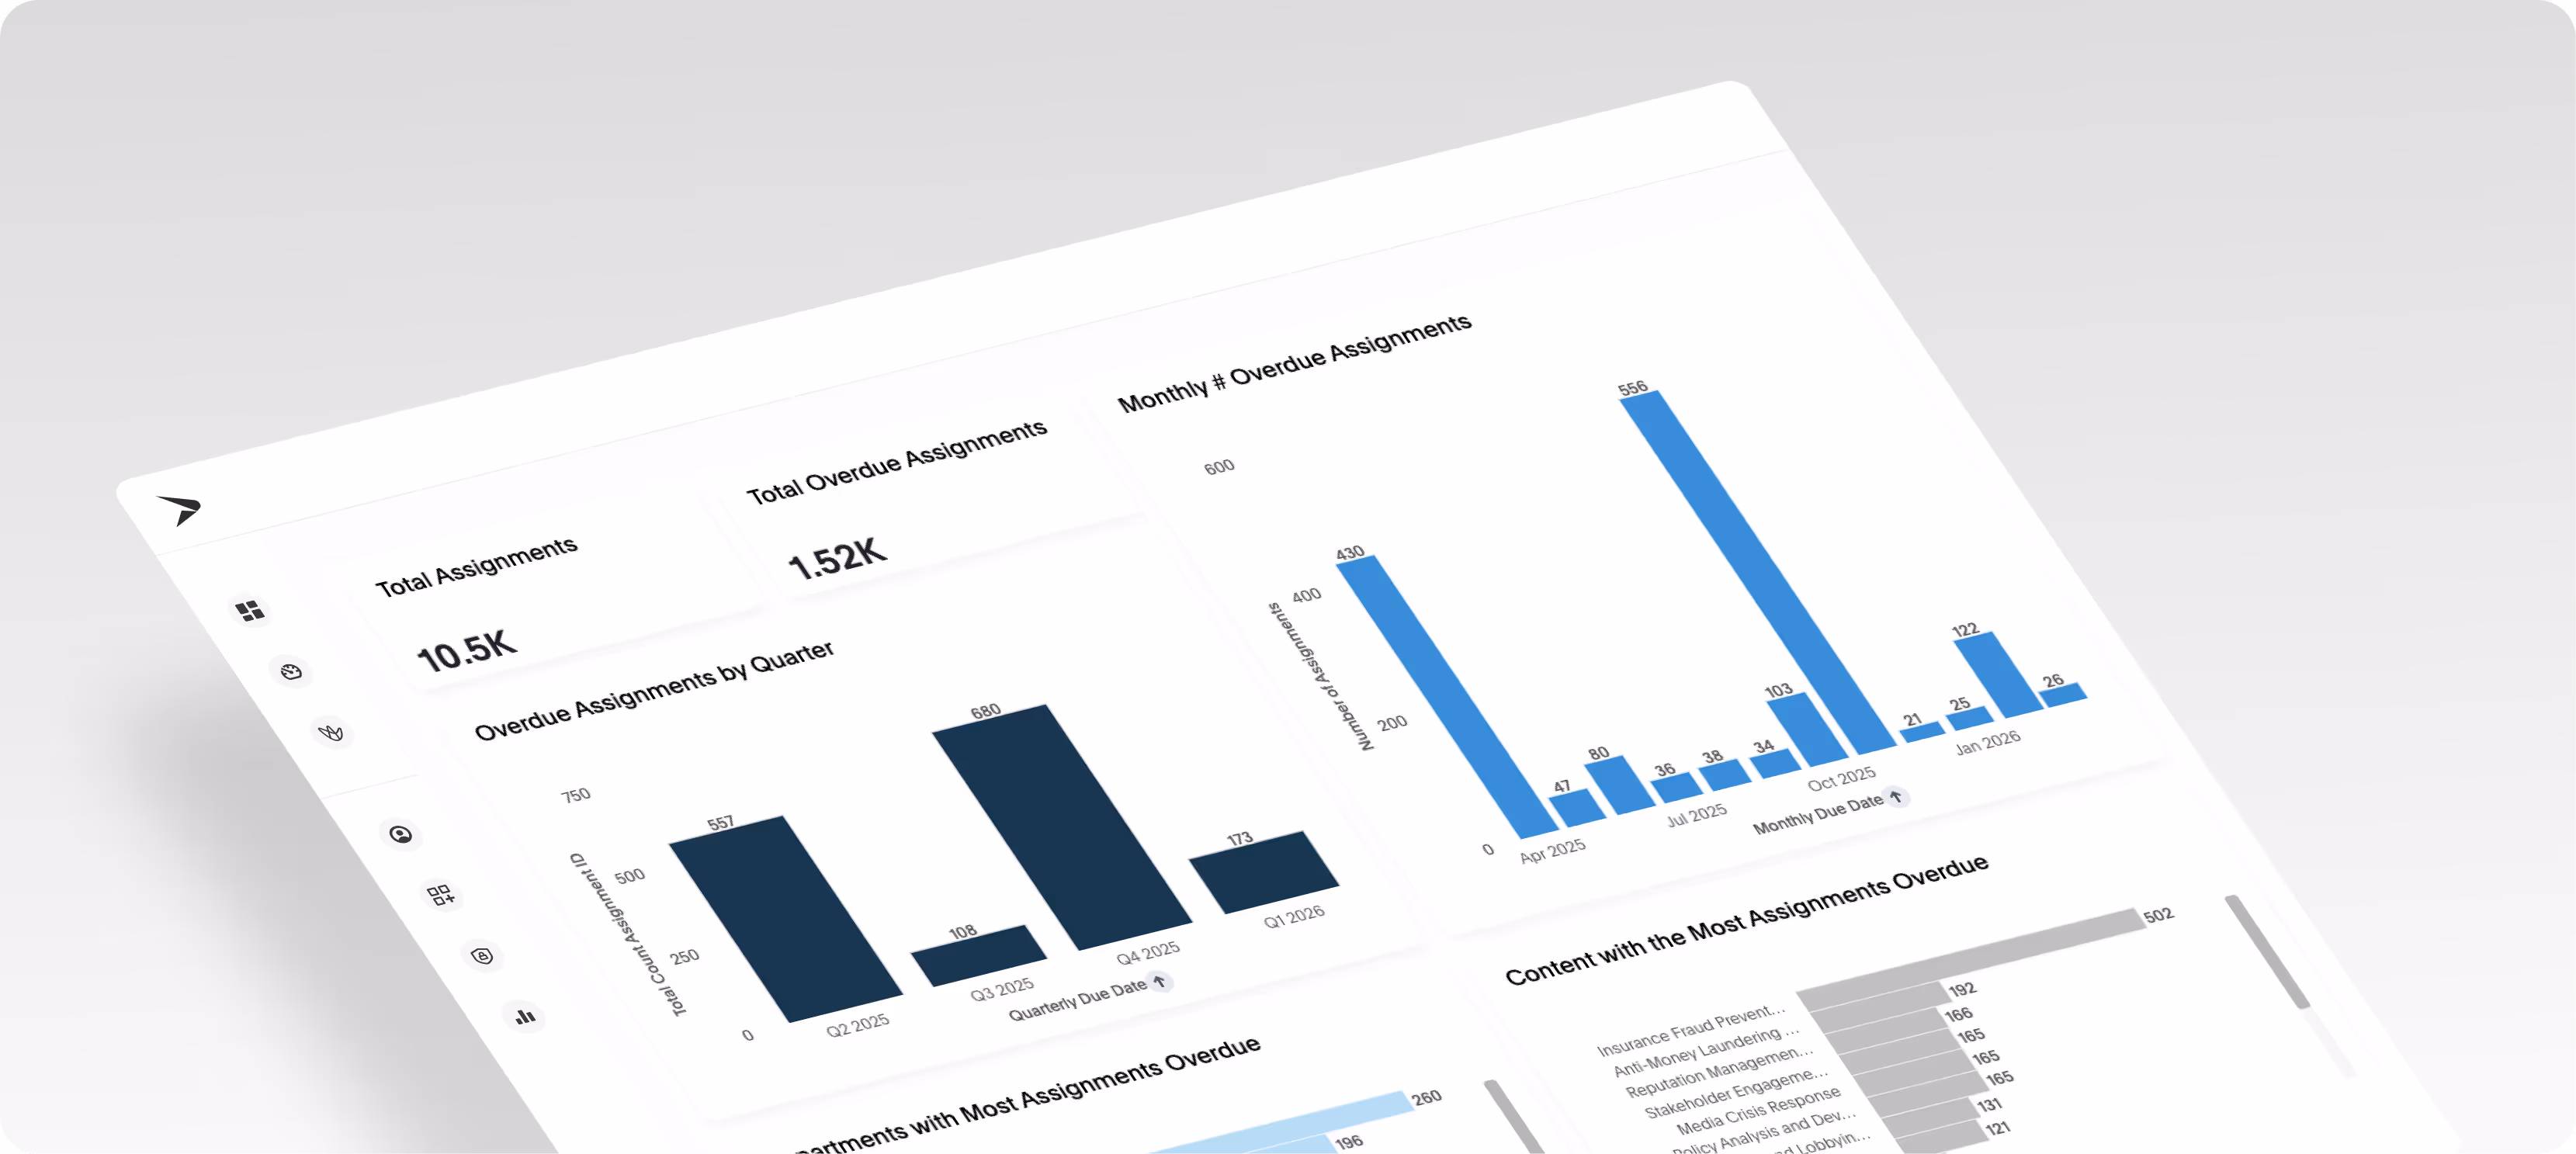
Real-Time Dashboards
Live charts for completion, engagement, and certification — always up to date, never stale.

AI Queries
Ask Eddy any question about your data in plain English and get instant visual answers.

Salesforce Integration
Connect enablement data to pipeline metrics and see how partner certification impacts deal velocity.

Channel Manager Views
Give channel managers a dashboard showing their partners' progress and certification status.

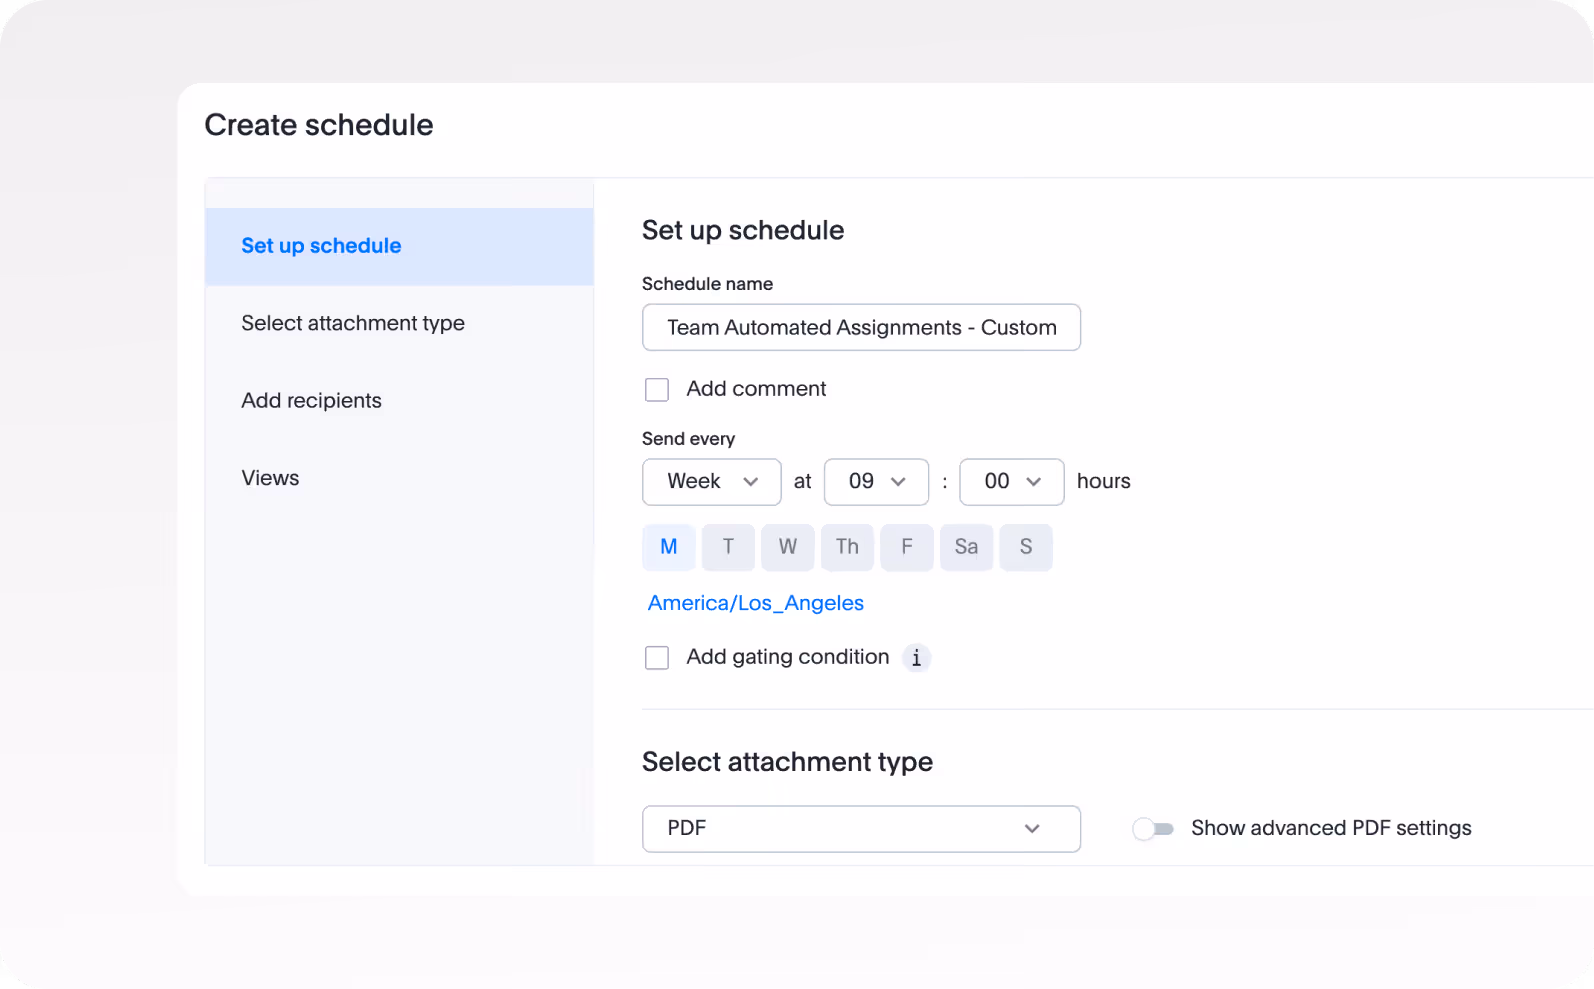
Scheduled Reports
Send weekly or monthly reports to stakeholders via Slack, MS Teams, and Email.

Compliance Tracking
Monitor certification deadlines and generate audit-ready reports on demand.

Trend Analysis
Spot engagement trends over time — to measure learning effectiveness.

Visualization Options
Choose from a variety of ways to display your data like bar graphs, columns, and line charts.
Business Impact
Executive Reporting
Custom dashboards show completion rates, engagement trends, and certification status across partners, customers, and employees at a glance.

Enablement teams using Insights save 5+ hours per week previously spent on manual reporting.
Channel Visibility
Channel managers get dashboards showing who's on track, who's behind, and what needs attention — driving accountability without admin overhead..
Manager-level dashboards improve partner completion rates by 18% through visibility alone.
Works with
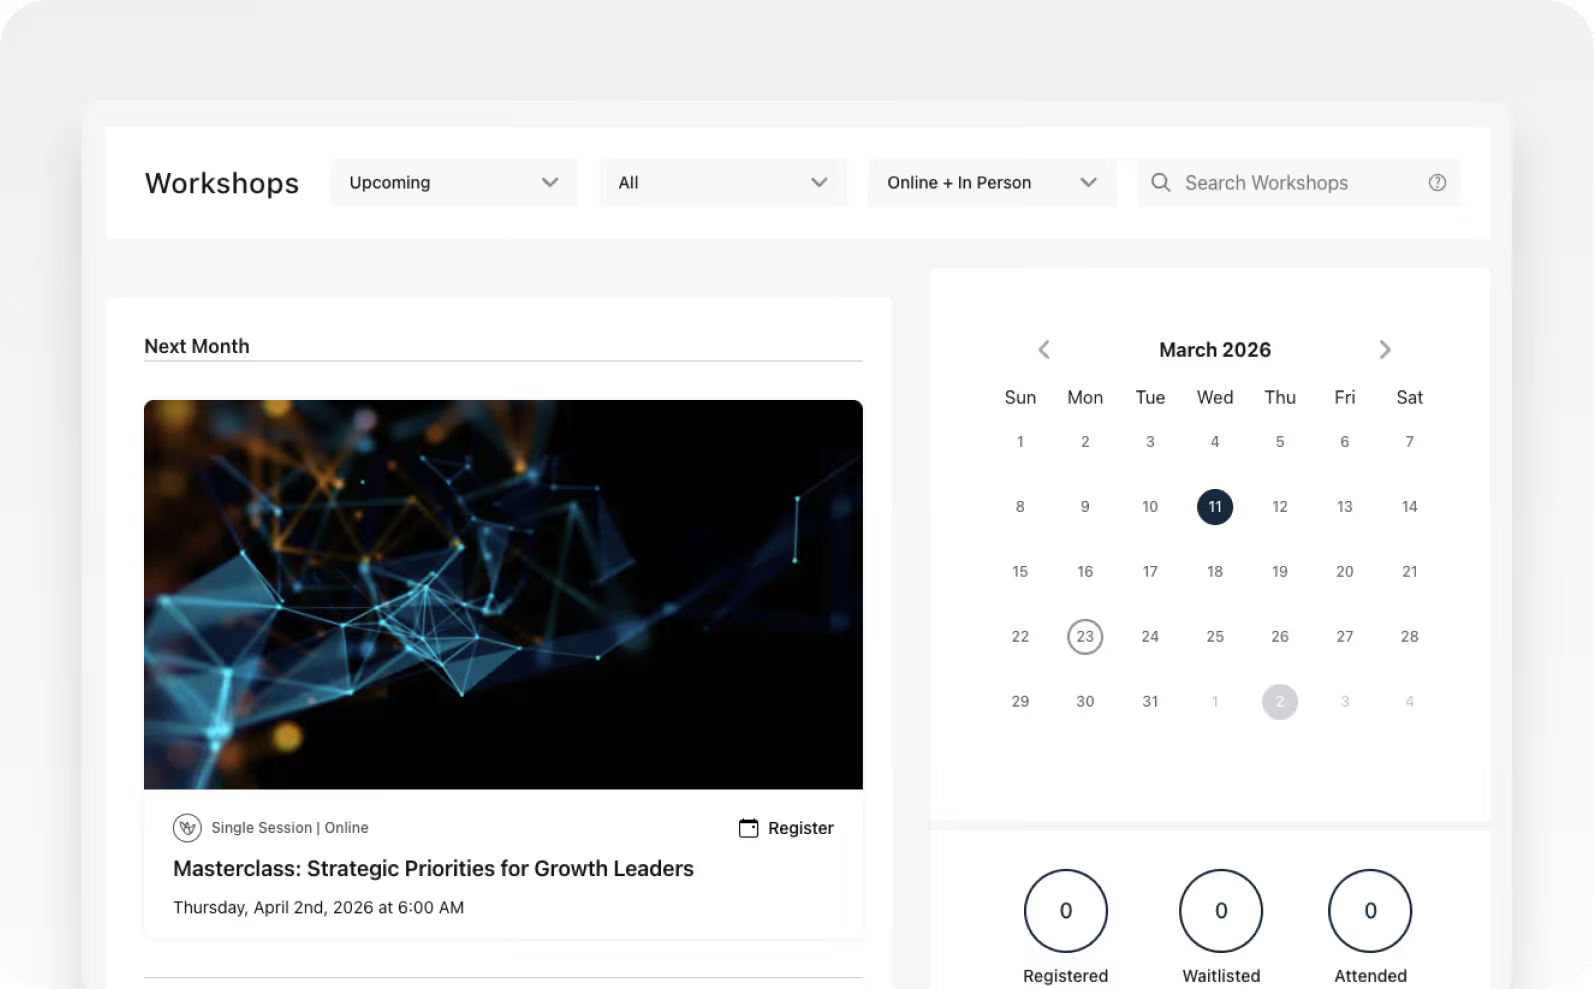
Host single or multi-session in-person and VILT workshops with attendance tracking and Google Calendar integration.
Explore Workshops


Build quizzes, knowledge checks, and graded assessments that prove your learners actually retained what matters.
Explore Assessments
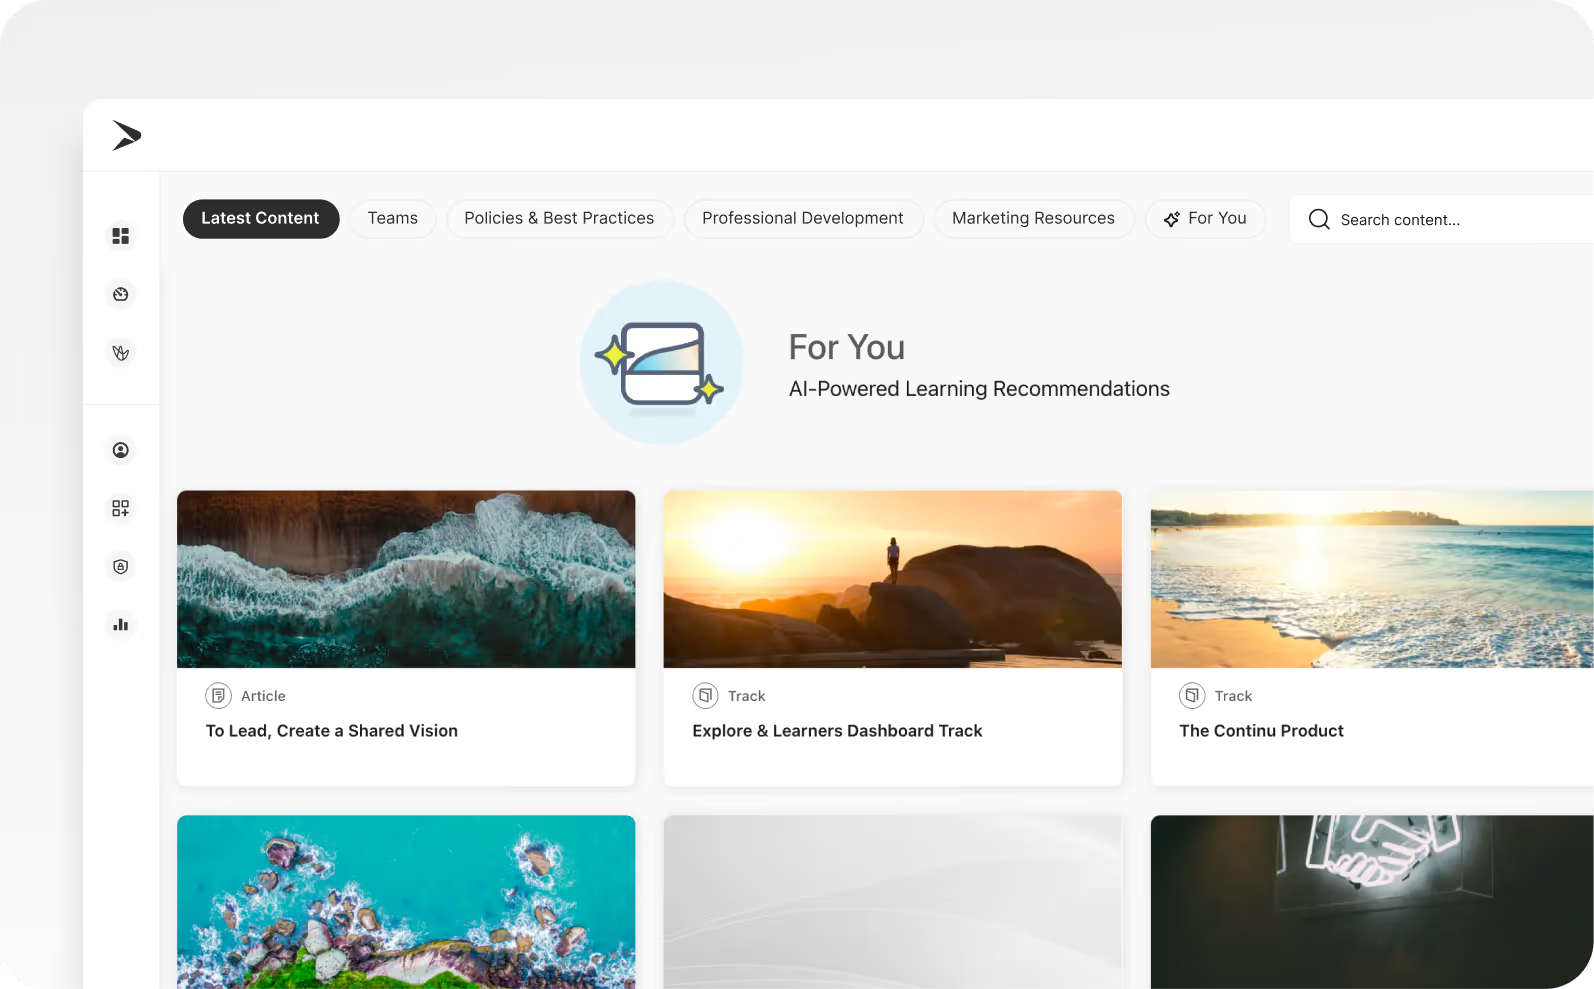
From curated recommendations to time-saving automations, Continu AI™ removes busy work from your plate.
Explore Continu AI
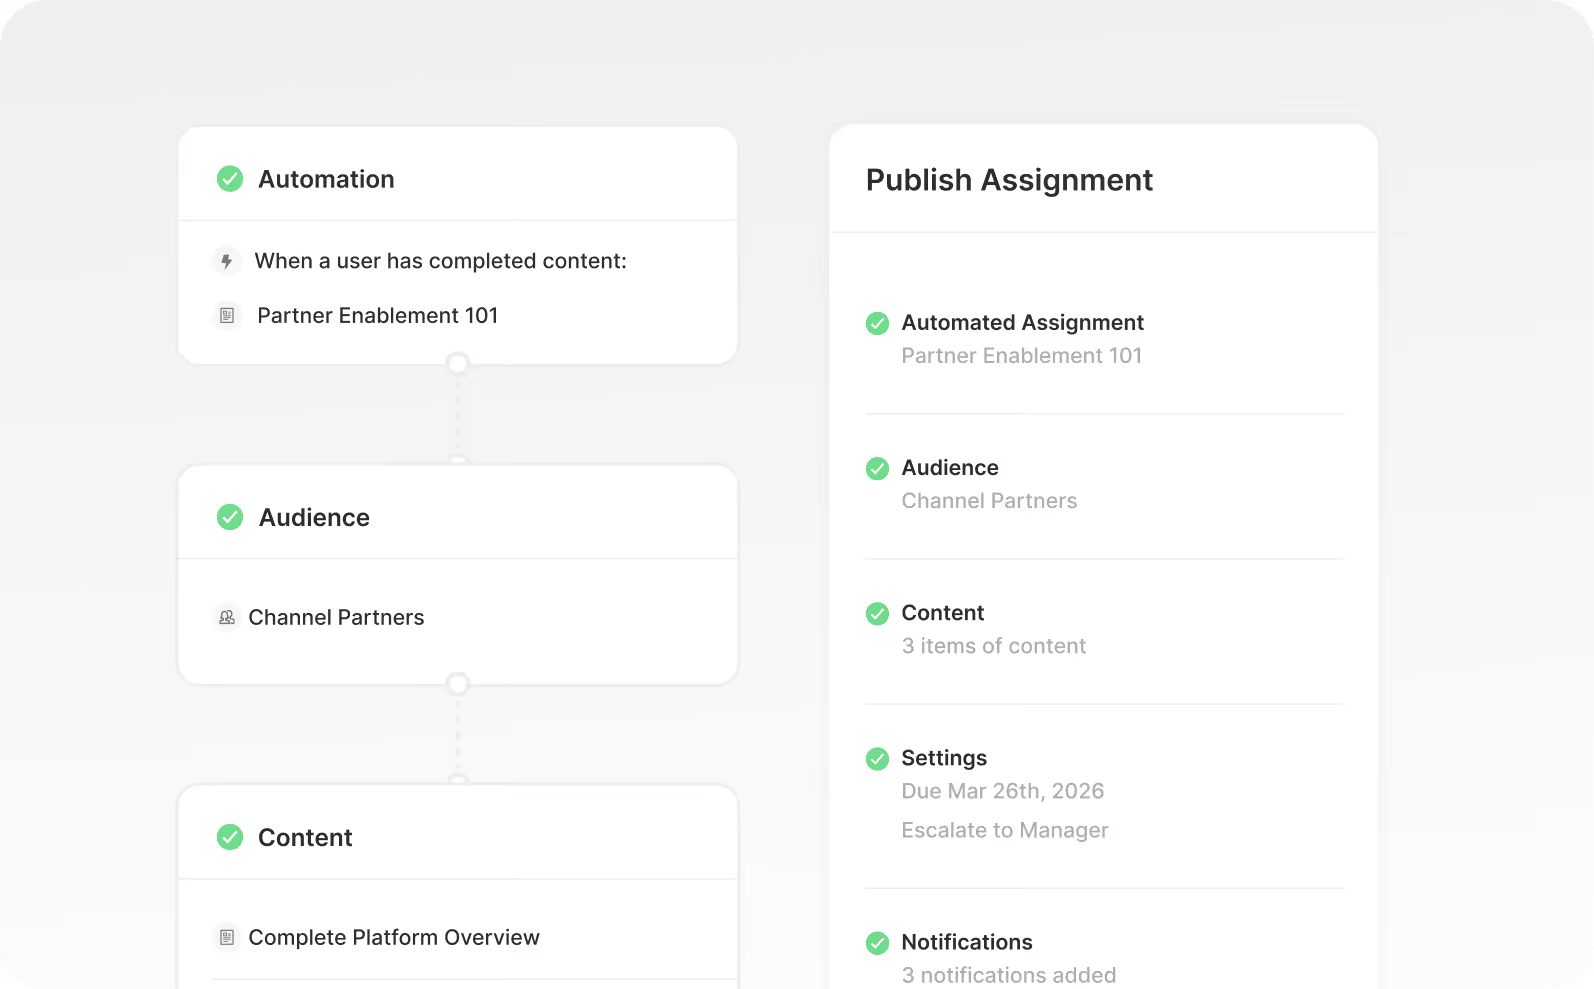
Automate training delivery with time-saving workflows that enroll learners and deliver enablement without manual work.
Explore Assignments
Because manual reporting tells you what happened, not why. Continu Insights connects learning activity to business outcomes in real time. Instead of spending hours compiling spreadsheets, your team asks a question and gets an instant answer. SoFi saved 285 hours of manual reporting work per year by switching to automated Insights.
Yes. Prompt-to-report technology means you type a question in plain English and get an answer. No filters, no pivot tables, no SQL. If you can ask a question, you can get the data. Custom dashboards are as easy as setting filters, picking the type, and pinning it to a page.
You don't have to. Insights lets you schedule automated reports delivered directly to Slack, MS Teams, email, or as a PDF or CSV on whatever cadence you set. Leadership gets what they need without you lifting a finger each cycle.
Yes. Custom dashboard building lets you pull any learning data from your system and visualize it the way your stakeholders actually want to see it. Completion rates by region, compliance progress by team, engagement trends over time. You define what matters.
Continu Insights goes beyond activity data. It surfaces patterns across teams, roles, and programs to show how learning is influencing ramp time, retention, compliance, and productivity. When a VP asks whether training is working, you have the answer backed by data, not instinct.
Continu Insights uses AI to instantly surface the metrics that matter so you can answer business-critical questions about your team’s learning effectiveness in seconds.
.avif)
.svg)

Continu is built to keep your data safe. We put privacy and security front and center, so you don’t have to.


